In this lesson we'll cover:
Before starting, be sure to read the overview to learn a bit about Yammer as a company.
Yammer not only develops new features, but is continuously looking for ways to improving existing ones. Like many software companies, Yammer frequently tests these features before releasing them to all of thier customers. These A/B tests help analysts and product managers better understand a feature's effect on user behavior and the overall user experience.
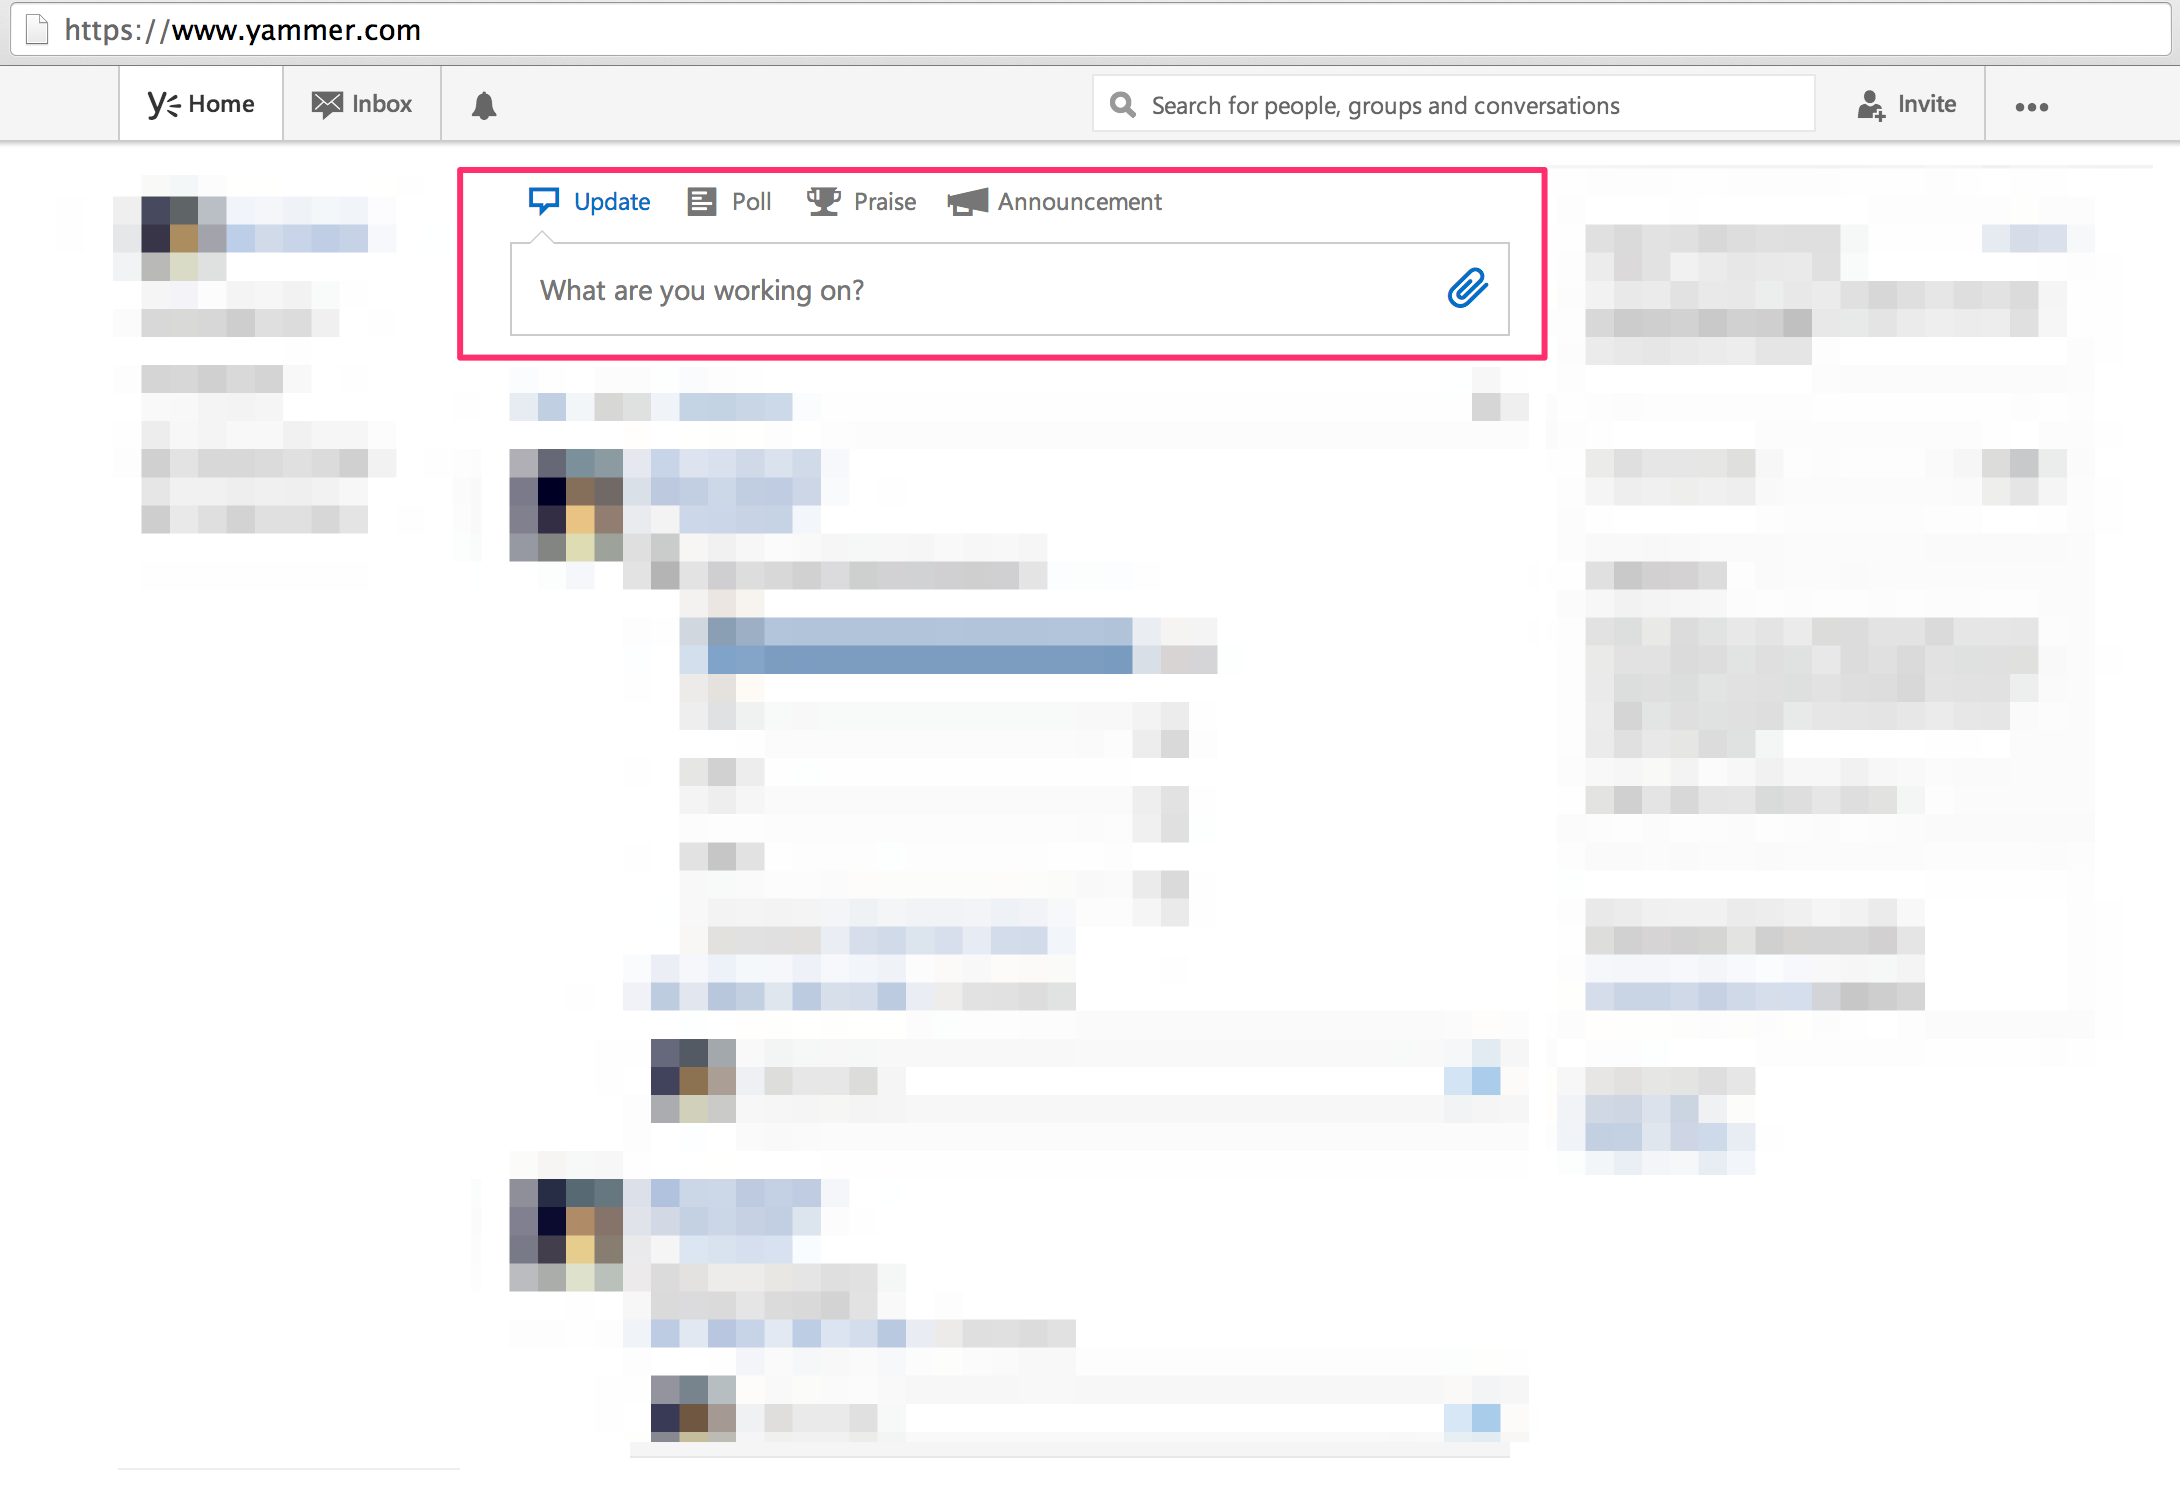
This case focuses on an improvement to Yammer's core “publisher”—the module at the top of a Yammer feed where users type their messages. To test this feature, the product team ran an A/B test from June 1 through June 30. During this period, some users who logged into Yammer were shown the old version of the publisher (the “control group”), while other other users were shown the new version (the “treatment group”).
On July 1, you check the results of the A/B test. You notice that message posting is 50% higher in the treatment group—a huge increase in posting. The table below summarizes the results:
The chart shows the average number of messages posted per user by treatment group. The table below provides additional test result details: